DashRadar development thread

Just looking at the inputs I would guess that the second transaction is more likely to be fraud because the inputs contain only a few different denominations (same denominations that getfreedash pays I assume). The first transaction seems to have more different denominations so it might be an exchange? Just guessing..

I created csv file that can be imported into gephi. The csv files have one line per address. The first column is the address and the rest of the columns are txids that spend from the address.
Here is the csv files:
gephi.csv
gephi_filtered.csv (doesn't contain addresses that have zero outgoing transactions)

When importing the files to gephi, choose the following options:
Separator: Comma
Import as: Adjacency list
Graph Type: Directed

So basically those files should allow visualizing all the "green concentrations". I'm still new to using gephi. I got some promising results using the "Force Atas2" layout.
 
It is very imporant to export the data to html/web, for anyone in the dash community (who is unable to use gephi) to be able to check the integrity of the data, and thus spot and report potential fraud in the getfreedash dividend.

A way to export the gephi files to html/web is this.
 
It is very imporant to export the data to html/web, for anyone in the dash community (who is unable to use gephi) to be able to check the integrity of the data, and thus spot and report potential fraud in the getfreedash dividend.

A way to export the gephi files to html/web is this.
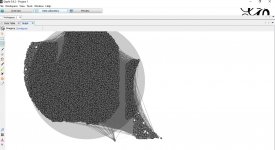
I guess I'm too lazy to do that but here is an image of the transactions that spend outputs from 100 or more of the payout addresses:
screenshot_213953.png
 
Last edited:
I guess I'm too lazy to do that but here is an image of the transactions that spend outputs from 100 or more of the payout addresses:
If you calculate the potential fraud of the dividend, your lazyness may cost a lot of money to the Dash community.
If the MNOs want the dividend to flourish, they should also allocate an amount of dash in order for someone to investigate potential frauds in the dividend and in order to built appropriate applications which facilitate fraud detection.
Otherwise the dividend is doomed, and if the dividend is doomed then the dash cryptocurrency is also doomed. Because the only crypto that will survive in the future, will be the one which will provide dividend to all of its members that can proove their individuality somehow.
And what prevents you from doing it?
 
And what prevents you from doing it?

I am not as good as you are, in that field.
For example. although I managed to install gephi, I cannot produce the graph from the data, like you did.
Why should I start doing something, when there is someone else who can do it better than me, and faster than me?
I am mediocre in most of the fields, and I know it. Whenever I try to do something, I always discover a better than me.
Instead of trying to re-invent the wheel, I am trying to encourage and help the one who is better than me to built more wheels.
 
Last edited:
Have you tried choosing and running "ForceAtas2" in the "Layout" part of "Overview" tab.
I did it and it is much better.
But how can I paint the incoming red and the outgoing green like you do in your dashradar site?

Can we create the superb colored image of dashradar, by using gephi ???

asd1-png.6529


I am lost....o_O:confused:
 
Last edited:

This tools seems great in visualizing getfreedash of @Dashmaximalist, but someone should teach us how to use it, or point to the correct youtube video that will help us accomplish our task, without the need of learning all the gephi enviroment!
 
I did it and it is much better.
But how can I paint the incoming red and the outgoing green like you do in your dashradar site?

Can we create the superb colored image of dashradar, by using gephi ???
Looks like colors might be possible using the gdf import format. It should also be possible to add timestamps to input and create an animated timeline. But I have to do other things now..
 
Update
  • Blocks are automatically reloaded in recent blocks page (block explorer)
  • Transactions are automatically reloaded in address page (block explorer)
  • Added loading indicator to charts page (charts)
  • Added two new connection types to make writing privatesend related queries easier (data explorer)
    • FIRST_ROUND connection from a "PrivateSend transaction" to a "mixing transaction" (PrivateSend input)
    • MIXING_SOURCE connection from a "mixing transaction" to a "create denominations transaction"
    • This example query shows how to get the number of "create denominations transactions" reachable from each input of a given PrivateSend transaction. (2-8 rounds assumed)
      • Note the huge difference in the anonyminity sets (6 vs 821)! The 6 is caused by certain mixing transactions only having create denominations transactions as an input. As a result there is no path to a 3rd round for that specific PrivateSend input. More information can found in this thread.
      • Edit: fixed error in the query
 
Last edited:
Update
Next I'm planning to add guesstimated wallet pages in the block explorer and change the PrivateSend analysis tool (demo) to use guesstimated wallets as the mixing sources.

If you are a masternode and haven't voted on my proposal yet, then please take a look and vote.

Edit: looks like there is something wrong with the address cluster clustering feature because the example queries no longer work. Investigating.fixed
 
Last edited:
Hello @Antti Kaikkonen
Your graph tool is just wonderful! Want to thank you for this.

I have one improvement suggestion
I'm constantly hit these limitations:
"Transactions has X inputs and Y output. Max limit is 200 inputs and outputs combined."
"This address has X transactions. Max limit is 200"
Can these limits be moved to settings so I can lift them when necessary?
Hi and thanks for the feedback!

I like your idea of making the limit configurable in the settings. Increasing the limit will probably cause massive lag issues as well as a visual mess. But I guess it should be a choice if the user wants to. Maybe I will make the limit configurable and change the message to a "do you want to proceed anyway" question.

In the future I'm planning to move away from svg rendering which should drastically improve the rendering performance. 3D visualization is also planned which should help with more than 200 connections taking so much space. I might also add address clustering support to the graph visualization which should also help with these issues.
 
Update:
  • Made the limit of max 200 connections/node configurable in the graph visualization as requested by @InhumanPerfection.
  • Added wallet pages to the block explorer.
    • Addresses are computed using only the multi-input heuristic. I might add other heuristics in the future but doing that increases the risk of generating false positives.
    • Currently just a list of addresses but current balance, balance chart etc is planned for the future.
    • Accessible from the address pages. For example https://dashradar.com/explorer/address/XdsaHNxXYBR4De7Ui59K8PYiqJdrfwUdUM seems to have 28 other associated addresses (which seem to also be masternodes).
  • Upgraded to Angular 6 from Angular 5
 
Update:

dashradar address balances.png
 
Suggestion for block explorer:
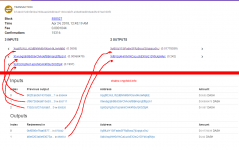
In transaction view: under addresses add "Previous output" and "Redeemed in" (like on chainz.cryptoid.info)
View attachment 7429
Previous output and redeemed in is already included in the links. "<" on the left side is a link to the previous output and ">" on the right side is a link to the redeeming input. The block numbers are not shown but can be accessed through the previous output and redeeming input links.
 
Back
Top